Diagnostics
Pheonix pulse
Pheonix pulse checks your websites every 60 seconds, around the clock. It emails you when one goes down and again when it's back. Go to Diagnostics → Pheonix pulse.
Subscribe
Pheonix pulse is a subscription. One subscription covers unlimited websites.
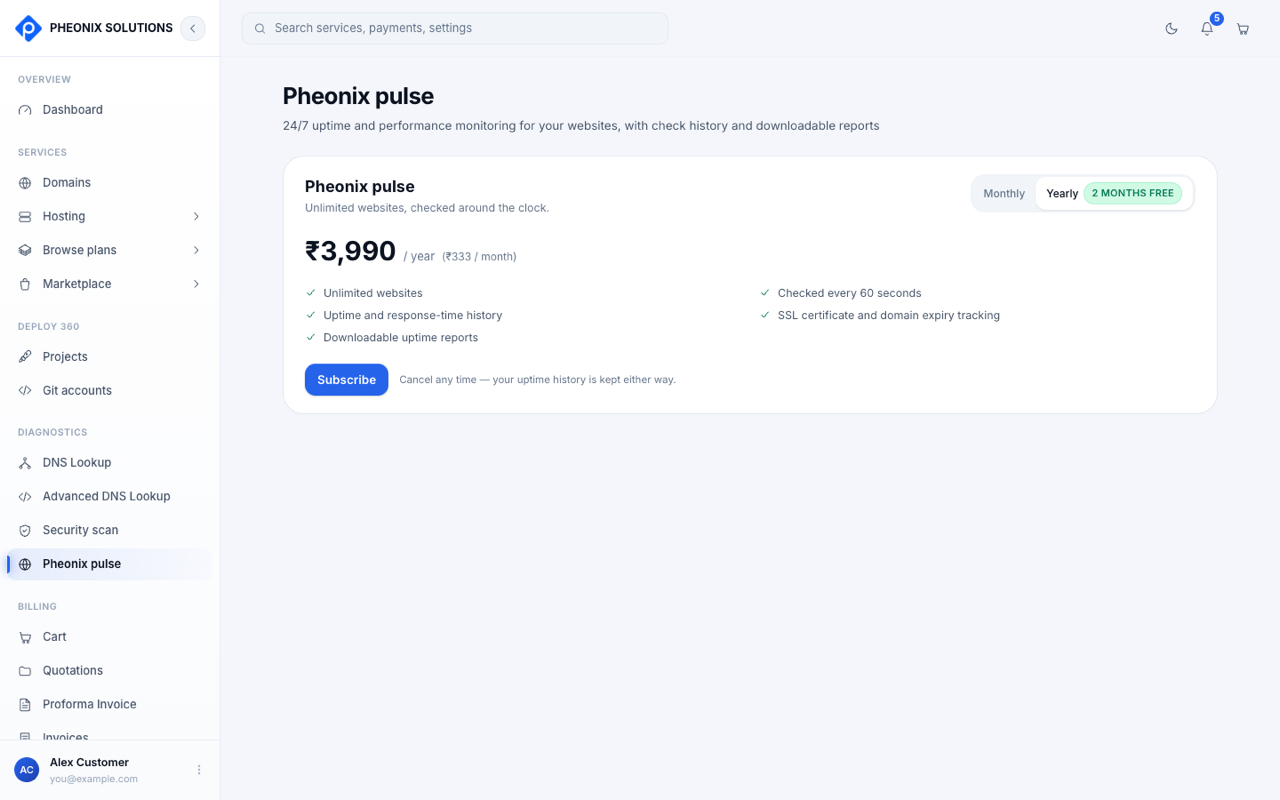
- Choose Monthly or Yearly. Yearly gives you months free.
- Select Subscribe and pay at checkout.
What's included:
- Unlimited websites
- A check every 60 seconds
- Uptime and response-time history
- SSL certificate and domain expiry tracking
- Downloadable uptime reports (PDF)
Add a website
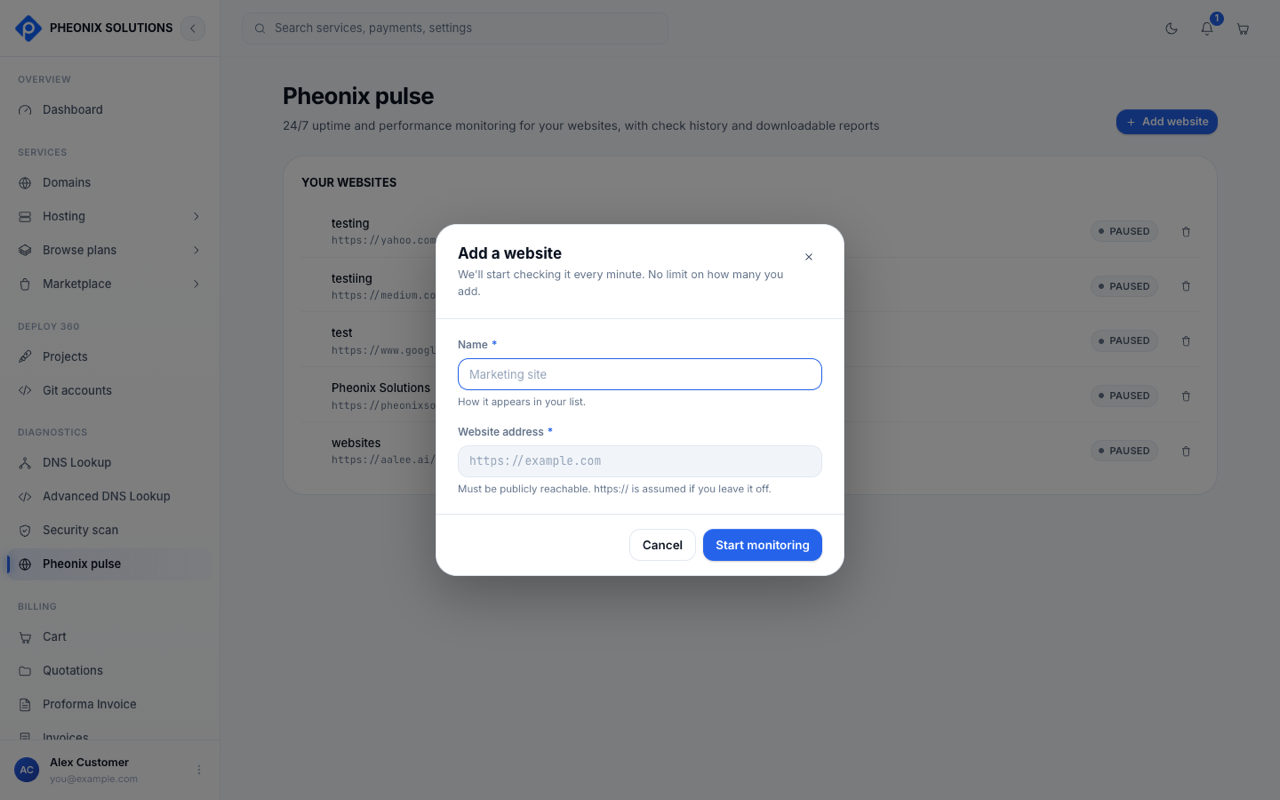
- Select Add website.
- Enter a Name, which is how it appears in your list, for example Marketing site. Up to 50 characters.
- Enter the Website address.
https://is assumed if you leave it off. The site must be publicly reachable. - Select Start monitoring. The first check runs within a minute.
You can add up to 3 websites per hour, and each address only once.
What we check
Every 60 seconds we request your website, the same way a visitor's browser would:
- The site counts as up if it answers with a success or redirect status (200–399) within 15 seconds.
- Up to 3 redirects are followed, and the SSL certificate must be valid.
Statuses
| Status | Meaning |
|---|---|
| Up | The latest check succeeded |
| Down | The site isn't answering, or is returning an error |
| Checking… | The first check hasn't finished yet |
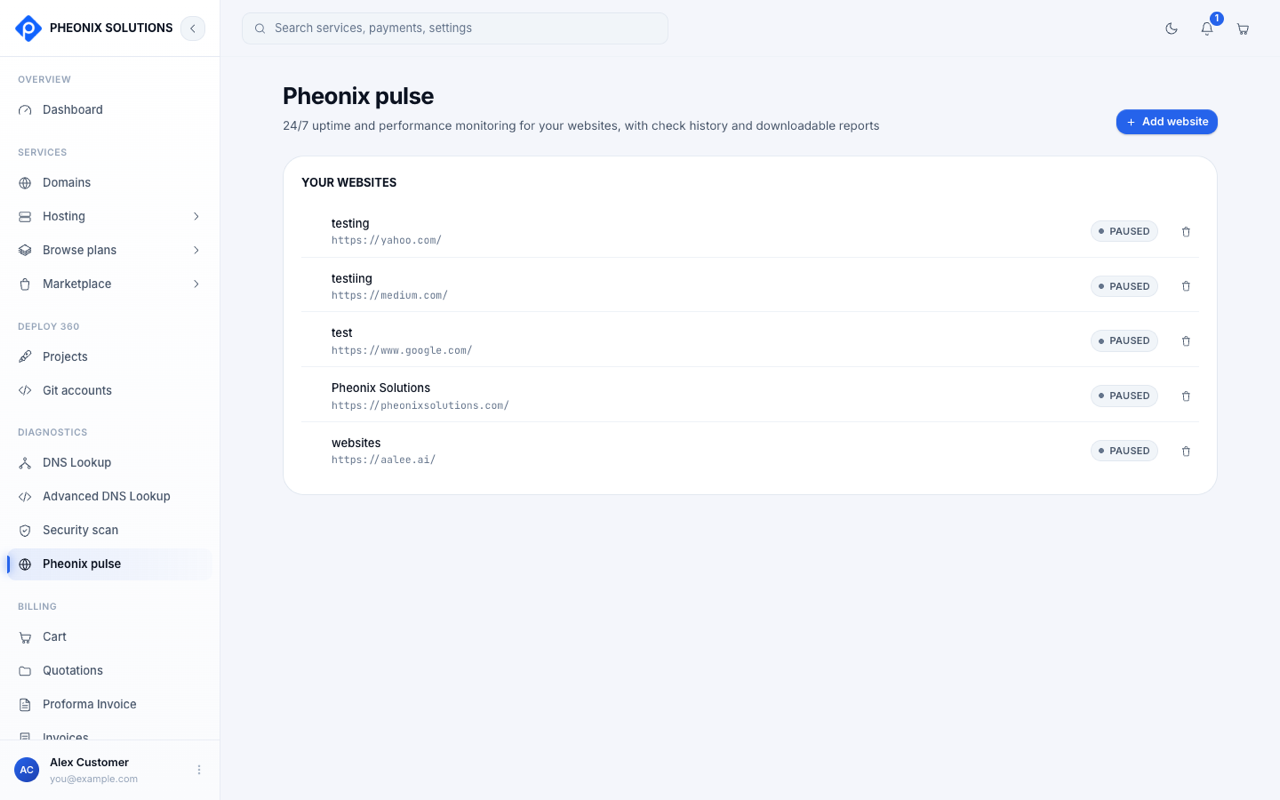
| Paused | Your subscription has ended. Checks stop, but your history is kept. Subscribe again to resume. |
Each website in the list also shows its uptime over the last 24 hours and its response time.
Alerts
- Down alert: after 2 failed checks in a row, you get an email and an in-app notification,
<name> is down. You're alerted once per outage, not every minute. - Recovery alert: when the site answers again, you get
<name> is back up, with how long it was down.
Alerts go to your account's email address. You can change it in Settings.
History and reports
Select a website to open its details.
- History: choose 3 hours, 24 hours, 7 days, 30 days or 12 months. Each period shows as Up, Partial outage, Down or No data, alongside response times.
- Cert exp. and Domain exp.: when the SSL certificate and the domain expire. They turn to a warning at 30 days or less, so you can renew in time.
- Check now: runs a check immediately and shows the HTTP status code and response time.
- Download report: saves a PDF uptime report for the selected period, ready to share with your team or clients.
Stop monitoring a website
Select the trash icon next to the website, then Stop monitoring.
Stopping monitoring deletes that website's history. If you add it again later, its history starts from zero. Download a report first if you need to keep it.
If your subscription ends
Websites keep being checked for 5 days after your paid period ends. After that they show Paused — subscribe to resume. History kept. Subscribe again, and checks resume straight away with nothing lost.
To cancel your subscription, contact support.