Deploy 360
Monitoring and alerts
Open a project and go to the Monitoring tab.
Server usage
Graphs of how hard your site's server is working. Choose a Period of 1h, 6h, 24h or 7d.
| Graph | Shows |
|---|---|
| CPU | Share of the server's processors in use |
| Memory | Memory used, against the server's total |
| Disk | Space used, against the disk's size |
| Network | Traffic in and out |
| Load average | Processes waiting to run, over 1, 5 and 15 minutes |
Usage alerts
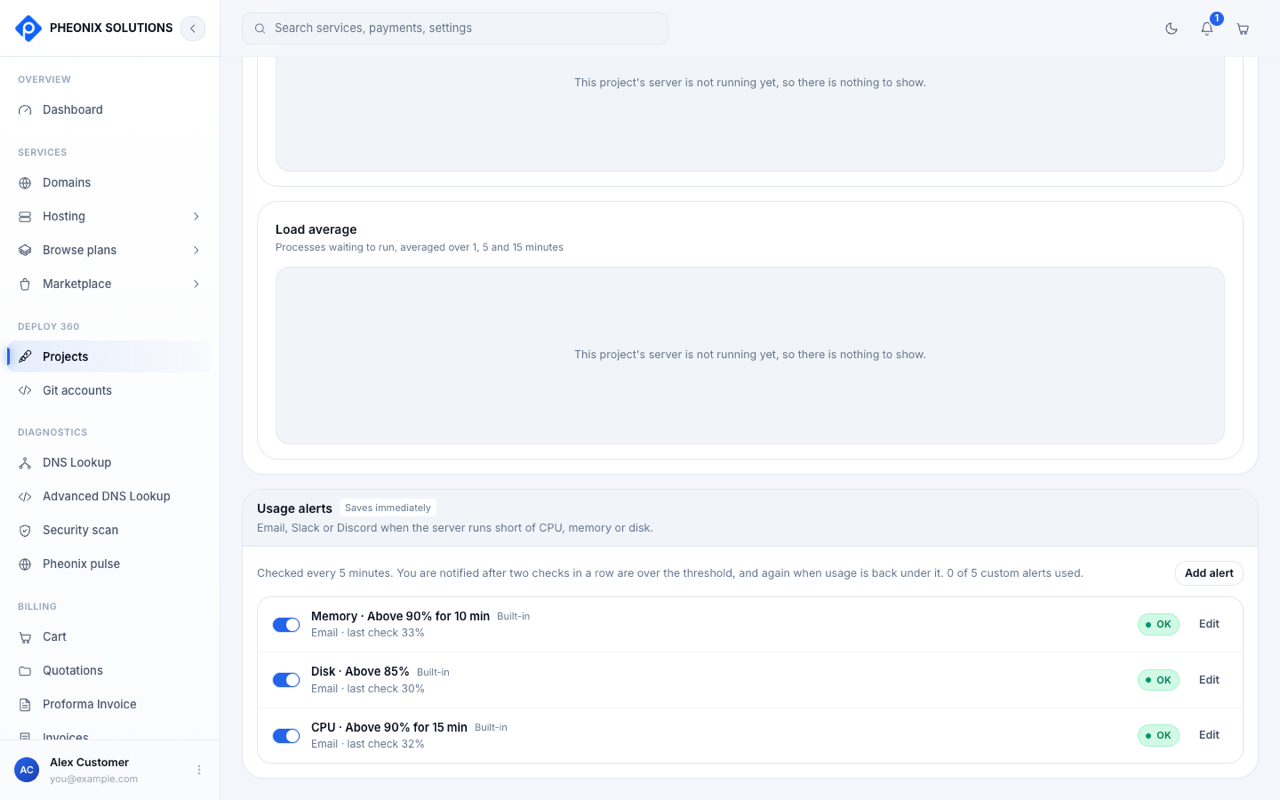
Every site comes with three built-in alerts:
| Alert | Fires when |
|---|---|
| Memory | Above 90% for 10 minutes |
| Disk | Above 85% |
| CPU | Above 90% for 15 minutes |
- Usage is checked every 5 minutes. You get an email after two checks in a row are over the threshold, and another when usage is back under it.
- Turn an alert on or off with its toggle, or select Edit to change its threshold.
- Select Add alert to create your own. You can have up to 5 custom alerts.
- Each alert shows its state: OK, Alerting or Off.
tip
If memory or CPU alerts keep firing, your site has outgrown its plan. Move to a bigger plan. Your server is resized in a few minutes.